The Phosphate Starvation Rescue System
RESEARCH GROUP

Javier Paz-Ares
Group Leader
Research Summary
Our primary interest is to contribute to the unraveling of regulatory mechanisms of gene activity and their evolution in plants. We chosen the phosphate starvation responses for our studies, as these responses have been a model system since the beginning of Molecular Biology, and additionally in plants it is considered to have great biotechnological potential in developing plants with improved nutrient use efficiency, a major aim towards implementing sustainable agriculture practices. In the past we have been main contributors to the deciphering of the Pi starvation signalling pathway, following forwards and reverse genetics approaches, that, among others, lead to the identification of the master transcription factor PHR1, SPX sensors and miRNA inhibitors. More recently we are exploring the natural variation of the Pi starvation response, at the transcriptomic, metabolomic and physiological level. In addition, we have also implemented a single-cell transcriptomics approach to gain a high resolution insight on transcriptomic changes associated to phosphate starvation
Research Lines
The two research lines currently ongoing are 1) Natural variation studies of the phosphate starvation responses and 2) High resolution analysis of the phosphate starvation transcriptomi using sc-RNA seq. Regarding the studies on Natural variation, We have analysed the transcriptome, (untargeted) metabolome and physiological traits of 200 Arabidopsis accessions grown under Pi starvation conditions . With these we have generated the transcriptional network underlying Pi starvation in Arabidopsis and its correlation with phenotypic traits and metabolite accumulation. In addition and integrated GWAS approach led us to identify more that 18000 eQTLs affecting gene expresión, metabolite accumulation and/or physiological traits. Out of these, we identified 1295 hotspots each afecting either the expression of more than 20 genes or the accumulation of more tan 20 metabolites. Interestingly, out of these hotspots, 12 of them also affected the performance of one or mor physiological traits. We developed methodology for discovery of candidate genes underlying gene expression/metabolite accumulation hotspots and their validation is in progress.

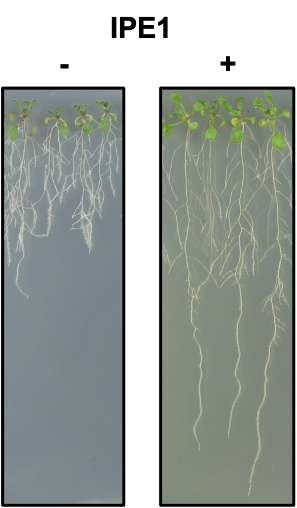
Effect of IPE1 on growth performance of Arabidopsis under Pi limiting conditions. Plants were grown for 13 days on low Pi medium (25 μM) in the presence or absence of IPE1.
Also, within the framework of this research line, we are currently investigating the natural variation of the growth response of Arabidopsis to the IPE1(Improved P use Efficiency 1) product, which was found by Miguel Blazquez’s and David Albadi’s team (IBMCP, Valencia) to improve plant performance under Pi limiting growth conditions (Figure 1). Following a GWAS approach, we aim to identify the mechanism underlying the effect of IPE1. We are currently integrating physiological and transcriptomic data to identify potential IPE1 target genes/pathways.
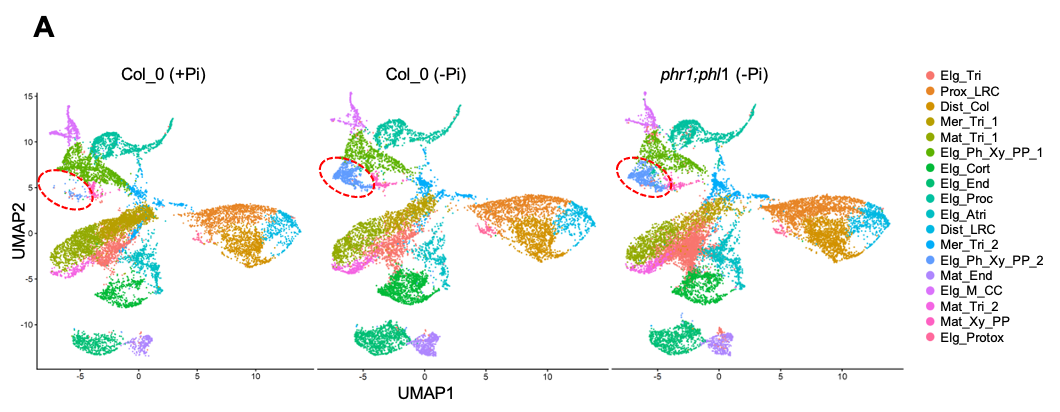
Regarding the high resolution analysis of the transcriptome of Pi starved roots of Arabidopsis, we performed RNA seq of the reference accession Col-o as well as the phr1phl1 double mutant (key regulators of the response to phosphate fasting) grown at low Pi and high Pi regimens. Principal component analyses of the scRNAseq data indicate that there are no major observable alterations in the different cell types in response to phosphate starvation or in the mutant background, except in the elongating cells of the phloem and xylem pole pericycle, which are greatly increased in plants subjected to phosphate starvation (Figure 2). This occurs both in wild-type and double mutant plants, indicating that this alteration is not controlled by the central regulatory system PHR1/PHL1.

Transcriptomic atlas at the cellular level of Pi starved Arabidopsis roots. UMAP (Uniform Manifold Approximation and Projection) graphical representation, where each point represents a cell. According to principal component analysis, the cells are divided into 18 different cell types/differentiation stages. The cell type displaying differences between +P and -P grown plants is encircled in red.
Publications
Group Members
Group Leader
Javier Paz-Ares
Staff Scientists
Maria Isabel Puga
Cesar Poza-Carrión
Lab assistants
Laura Perez-Liens
Erica Gil Velasco


